Category:Thermodynamics
Zur Navigation springen
Zur Suche springen
Teilgebiet der Physik 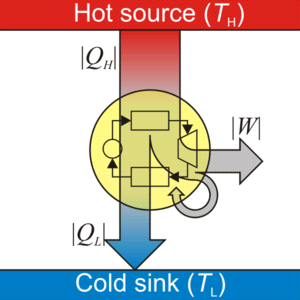 | |||||
| Medium hochladen | |||||
| Aussprache (Audiodatei) | |||||
|---|---|---|---|---|---|
| Ist ein(e) |
| ||||
| Unterklasse von | |||||
| Ist Teil von | |||||
| |||||
Unterkategorien
Es werden 43 von insgesamt 43 Unterkategorien in dieser Kategorie angezeigt:
In Klammern die Anzahl der enthaltenen Kategorien (K), Seiten (S), Dateien (D)
*
A
- Thermoacoustics (15 D)
B
C
- Constructal law (3 D)
D
- Thermal decomposition (28 D)
E
- Equation of state (53 D)
- Exergy (18 D)
- Experimental thermodynamics (22 D)
F
- Flashover (4 D)
G
H
- H-theorem (2 D)
I
- Ideal mixtures (8 D)
L
- Laws of thermodynamics (20 D)
- Thermodynamics lectures (5 D)
M
- Maximum power principle (2 D)
- Mean free path (10 D)
P
- Thermophoresis (4 D)
R
- Rollover (fire) (2 D)
S
- Stefan–Boltzmann constant (1 D)
T
U
- ⧧ (2 D)
V
Seiten in der Kategorie „Thermodynamics“
Diese Kategorie enthält nur die folgende Seite.
Medien in der Kategorie „Thermodynamics“
Folgende 200 Dateien sind in dieser Kategorie, von 220 insgesamt.
(vorherige Seite) (nächste Seite)-
2nd pic gradient.png 1.685 × 838; 155 KB
-
Adiabatic flame temperature (diagram).jpg 706 × 297; 75 KB
-
Air mu lambda.png 771 × 735; 11 KB
-
Argon b c.jpg 852 × 524; 54 KB
-
Asakura-Oosawa first two cases.png 312 × 209; 3 KB
-
-
Asymptotic albedo 2.png 771 × 740; 6 KB
-
Autocascade.png 800 × 600; 38 KB
-
Balloon graph representing quality EROI.png 850 × 625; 217 KB
-
Belousov-Zhabotinsky Reaction Simulation Snapshot.jpg 300 × 300; 35 KB
-
Beta vs E two state.svg 540 × 360; 43 KB
-
Bild wasserhaut.png 744 × 1.724; 21 KB
-
Bomba termodinamica.png 313 × 223; 3 KB
-
Bombas de calor.png 1.003 × 608; 137 KB
-
Brennstoffzellentechnik3.jpg 1.118 × 560; 52 KB
-
Britannica Diffusion.jpg 317 × 156; 14 KB
-
BWRS-reduced 1.jpg 946 × 474; 96 KB
-
Carnot theorem paradox.svg 632 × 394; 84 KB
-
Carnot-engine-1824-vector.svg 354 × 744; 14 KB
-
CFSE DH.png 497 × 400; 8 KB
-
Characteristic points wiki.svg 560 × 420; 83 KB
-
CharacteristicCurves.png 5.727 × 5.757; 196 KB
-
Chempotential.jpg 911 × 375; 36 KB
-
Ciclo.gif 400 × 225; 9 KB
-
Cilindro con émbolo.svg 135 × 121; 16 KB
-
Ciocniri-moleculare.jpg 738 × 243; 57 KB
-
COGAS-it.png 415 × 432; 38 KB
-
ColdnessScale.svg 312 × 324; 76 KB
-
Compressibilité isotherme de SF6 - penta.png 627 × 342; 25 KB
-
Compressibilité isotherme de SF6 - tetra.png 611 × 332; 22 KB
-
Compressibilité isotherme de SF6.png 618 × 420; 36 KB
-
Concentrations réaction.GIF 825 × 536; 33 KB
-
Conservacion de la energíacon flujos de calor y trabajo.png 1.173 × 263; 12 KB
-
Conservative Temperature vs. potential temperature.png 743 × 610; 62 KB
-
Cox-Othmer diagram for alcohols.jpg 465 × 433; 65 KB
-
Critical isotherm Redlich-Kwong model.png 554 × 390; 20 KB
-
Cálculo de constantes de vaporización.png 205 × 51; 3 KB
-
Dalton1.gif 213 × 213; 3 KB
-
Danlira1991 zeros ones 360000pts py3 SI white 130levels2.png 1.215 × 1.020; 344 KB
-
De-Thermodynamik.ogg 1,7 s; 15 KB
-
De-thermodynamisch.ogg 1,9 s; 19 KB
-
DEC.svg 748 × 503; 32 KB
-
Derived Schwarzschild Units 2014 CODATA.png 12.976 × 7.772; 4,62 MB
-
Deriving Emergent gravity from microscopic theories.jpg 840 × 480; 248 KB
-
Dh Top.gif 828 × 818; 170 KB
-
Diagram Systems.svg 300 × 167; 79 KB
-
Diagrama de cuerpo libre de un émbolo.svg 92 × 112; 18 KB
-
Diagrama PV del Ciclo de Diesel.svg 313 × 246; 47 KB
-
Dimensionless Lenard Jones 6-12.png 778 × 587; 17 KB
-
Distribution of.jpg 872 × 384; 28 KB
-
Dynamic heating.png 559 × 281; 5 KB
-
Ecuación Rachford-Rice.png 144 × 62; 2 KB
-
Efecto de memoria-EN.png 960 × 720; 20 KB
-
Efeito Fotoelétrico.png 2.486 × 552; 54 KB
-
Eight founding schools.png 518 × 454; 284 KB
-
Energy Diagram.png 634 × 551; 9 KB
-
Energy Flow General.svg 309 × 278; 9 KB
-
Energy landscape for 75 atom Leonard-Jones cluster.tif 1.513 × 2.475; 2,27 MB
-
Energy yield of iron reduction.png 1.400 × 559; 26 KB
-
Esquema de transferência de calor(baseada no esquema feito pelo GrupoTérmicos).png 1.451 × 1.079; 100 KB
-
ExpemplaricObservable.png 5.637 × 3.624; 91 KB
-
Fig-LSD.jpeg 3.069 × 1.534; 1,29 MB
-
Fijar una referencia Calculo de entalpia absoluta.png 614 × 724; 51 KB
-
Flow of Whole Process.svg 632 × 217; 17 KB
-
Flujo de energía asociado a una corriente.png 453 × 489; 6 KB
-
Fonction phase rayonnement emergent Milne.png 771 × 782; 43 KB
-
Fugacidades.png 180 × 56; 2 KB
-
GAP2.JPG 673 × 317; 32 KB
-
Geschwindigkeitsabhängigkeit der Temperatur.png 622 × 418; 13 KB
-
Geschwindigkeitsabhängigkeit des Druckes.png 622 × 418; 13 KB
-
Gibbs free energy changes Endergonic reaction.png 647 × 590; 22 KB
-
Gibbs free energy changes Exergonic reaction.png 659 × 590; 21 KB
-
Grafico pressione ridotta - coefficiente di fugacità.png 581 × 335; 17 KB
-
Grafik Ehrenfest Modell.png 964 × 311; 3 KB
-
GraphHeatCapacityElements SelectedRange.png 3.216 × 2.461; 97 KB
-
GraphHeatCapacityOfTheElements.png 3.216 × 2.461; 104 KB
-
GraphHeatCapacityOfTheElementsI2s.png 3.216 × 2.461; 108 KB
-
Gruppenbeitragsmethodenprinzip.png 794 × 756; 46 KB
-
Gràfic Texturòmetre Merenga al 50%.png 749 × 380; 73 KB
-
GT-Prozess mit internem Wärmeaustausch Schaltbildltbild.jpg 1.059 × 955; 82 KB
-
Heat Diagram.PNG 535 × 304; 8 KB
-
Heat engine summary.png 300 × 300; 47 KB
-
Heatflux.png 669 × 520; 22 KB
-
Heating curve blank labelled exam.svg 475 × 270; 8 KB
-
HeatTransmission Tubular.svg 193 × 186; 39 KB
-
HeatTransmission.svg 208 × 168; 10 KB
-
HGsaturationcurve.jpg 464 × 375; 8 KB
-
Hush adiabatic electron transfer basics.png 427 × 498; 42 KB
-
HVAC system diagram.jpg 600 × 471; 72 KB
-
Ideal gas law relationships.svg 512 × 341; 2 KB
-
Images of water and saline solution being heated.jpg 568 × 400; 30 KB
-
John Tyndall - 1863 - Pictet's experiment.jpg 534 × 1.437; 399 KB
-
Joule-Thomson - van der Waals.jpg 420 × 560; 52 KB
-
KirkendallEffektSchemat.png 635 × 701; 22 KB
-
Kraftwerkwirkungsgrad.jpg 2.000 × 1.244; 390 KB
-
KWK Prinzip und T-s-Dia.jpg 1.279 × 653; 201 KB
-
Laminazione.png 476 × 332; 28 KB
-
Larger System for Exergy Calculation.svg 324 × 298; 39 KB
-
Leidenfrost droplet es.svg 836 × 616; 7 KB
-
Lenoir-vs-otto.svg 540 × 360; 43 KB
-
LJ mixtures.png 14.412 × 11.984; 996 KB
-
LJ PhaseDiagram.png 6.566 × 5.916; 220 KB
-
-
Loss of Work in Combustion.svg 402 × 252; 12 KB
-
Loss of Work in Heat Exchanger.svg 529 × 270; 24 KB
-
Loss of Work in Throttling.svg 508 × 235; 8 KB
-
Loss of Work in TurbineA.svg 406 × 252; 15 KB
-
Loss of Work in TurbineB.svg 417 × 252; 13 KB
-
Marks Decahedron, stable shape for five-fold twinned nanoparticles.gif 1.461 × 1.427; 135 KB
-
MathQA-Screenshot.png 1.036 × 766; 82 KB
-
Maxwells Demon.png 409 × 175; 4 KB
-
Metabolismo eue.jpg 417 × 105; 6 KB
-
Methode SN milieu homogene omega=1 bis.png 771 × 776; 39 KB
-
Mie phasediagram.svg 706 × 351; 53 KB
-
Miepotential.svg 351 × 261; 31 KB
-
MolareWärmekapazitätDerElemente Bereich.png 3.216 × 2.461; 99 KB
-
Molecules transferring energy.png 1.326 × 1.994; 523 KB
-
Moteurthermo.png 300 × 236; 11 KB
-
NDL1032255 熱力学 上巻.pdf 5.160 × 3.733, 69 Seiten; 29,75 MB
-
NDL1145644 熱力学 part1.pdf 6.041 × 4.447, 100 Seiten; 48,15 MB
-
NDL1145644 熱力学 part2.pdf 6.041 × 4.447, 32 Seiten; 15,24 MB
-
NDL1683719 熱力学 part1.pdf 8.431 × 5.687, 100 Seiten; 161,35 MB
-
NDL1683719 熱力学 part2.pdf 8.431 × 5.687, 100 Seiten; 153,75 MB
-
NDL1683719 熱力学 part3.pdf 8.431 × 5.687, 18 Seiten; 29,13 MB
-
NDL942888 熱力学 part1.pdf 5.956 × 3.920, 100 Seiten; 59,08 MB
-
NDL942888 熱力学 part2.pdf 5.956 × 3.920, 47 Seiten; 26,72 MB
-
Nodes diagram.jpg 397 × 238; 13 KB
-
Non steady state probe tp08 hukseflux.gif 155 × 800; 7 KB
-
Non-equilbriumlandscape.svg 730 × 225; 38 KB
-
Orthograde and contragrade.jpg 1.311 × 690; 173 KB
-
Pac-Thermo.png 3.510 × 2.553; 1,38 MB
-
Pacthermo.svg 370 × 430; 10 KB
-
Paradoja de Jevons. Caracterización termodinámica..png 897 × 408; 48 KB
-
Particle-in-cuboid.svg 582 × 573; 16 KB
-
Phase-change.png 715 × 530; 38 KB
-
Physique I Optique- Physique nucléaire & Thermodynamique.jpg 800 × 450; 41 KB
-
Pictet's experiment.png 375 × 1.015; 405 KB
-
Pigeons on subway vent.jpg 3.024 × 4.032; 3,8 MB
-
PinFin.png 430 × 469; 26 KB
-
Press o de vapor.gif 719 × 253; 8 KB
-
Principio de conseervacion de la energía.png 832 × 595; 27 KB
-
Progression de réaction.jpg 798 × 497; 33 KB
-
Proof of Carnot Theorem.png 705 × 673; 35 KB
-
Proving Carnot Theorem.svg 717 × 629; 116 KB
-
Proving Clausius Inequality.svg 625 × 770; 27 KB
-
PV, P-діаграма реального газу.png 1.404 × 1.853; 263 KB
-
PV, P-диаграмма реального газа.png 1.404 × 1.853; 200 KB
-
Racines d'une équation d'état cubique.jpg 879 × 569; 74 KB
-
Rankine Hugoniot Shock-en.svg 741 × 641; 1 KB
-
Rankine Hugoniot Shock-ru.svg 741 × 641; 1 KB
-
Rankine Hugoniot Shock.png 330 × 288; 7 KB
-
Reactieprofiel.png 746 × 592; 15 KB
-
Reactivity EX est.svg 541 × 216; 18 KB
-
Reduced specific heat for KCl, TiO2, graphite 01.png 2.107 × 1.721; 299 KB
-
Régression de réaction.jpg 792 × 497; 32 KB
-
Schema pompa di calore.png 239 × 300; 108 KB
-
SchematicSimpleSystemStateSpace20170714.png 583 × 490; 77 KB
-
SchematicSimpleSystemStateSpace20170714SVG.svg 744 × 1.052; 18 KB
-
Screen Shot Sjabloon Math.png 1.005 × 439; 94 KB
-
Side view of LJ cluster with 75 atoms.gif 828 × 818; 146 KB
-
Specific heat of several glassy solids.png 1.496 × 2.098; 362 KB
-
Stagnation properties.png 936 × 492; 24 KB
-
State space diagram from Lightning in a Bottle.png 709 × 434; 120 KB
-
Steffan Boltzman planetary termperature.svg 723 × 2.264; 38 KB
-
Szilard engine schematic.png 416 × 245; 4 KB
-
T TR TV detente.png 771 × 707; 7 KB
-
Temperature negative 2.png 771 × 774; 13 KB
-
Temperature negative.png 771 × 774; 13 KB
-
Temperature profile.png 2.458 × 1.270; 98 KB
-
Temperature vs E two state.svg 540 × 360; 50 KB
-
Temperature.gif 402 × 359; 4 KB
-
Tflux.jpg 1.248 × 485; 65 KB
-
TFTE.jpg 1.443 × 695; 162 KB
-
The Belousov-Zhabotinsky Reaction.gif 300 × 300; 5,22 MB
-
The chemical potential of nitrogen and oxygen Van der Waals gases.png 700 × 700; 111 KB
-
-
The Joule-Thomson coefficient of the air.png 700 × 700; 147 KB
-
-
The Van der Waals gas constants of Nitrogen and Oxygen.png 745 × 787; 69 KB
-
Thermal efficiency vs pressure ratio Chart.PNG 492 × 403; 16 KB
-
Thermal pressure 1.png 504 × 431; 119 KB
-
Thermal pressure 22.png 646 × 425; 153 KB
-
Thermal pressure1.jpg 504 × 431; 32 KB
-
Thermal pressure2.jpg 646 × 425; 38 KB
-
Thermique1.png 323 × 341; 33 KB
-
Thermo.png 300 × 202; 11 KB
-
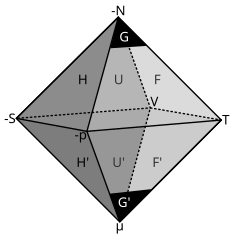
Thermodynamic Oktaeder.svg 849 × 860; 2 KB
-
Thermodynamic temperature.png 1.920 × 1.080; 961 KB
-
Thermodynamic-using-cambria-math.svg 36 × 50; 177 Bytes
-
Thermodynamics icon.svg 128 × 128; 6 KB
-
Toplotna ravnoteza.jpg 350 × 111; 5 KB
-
Traformazione adiabatica isoterma isocora.png 456 × 453; 5 KB
-
Transformação de sistemas.png 329 × 340; 78 KB
-
-
Travail.gif 320 × 124; 2 KB
-
Troca de calor.jpg 615 × 377; 51 KB
-
Ts diagram of N2 02.jpg 1.013 × 698; 276 KB
-
Two Paths of Larger System.svg 269 × 253; 30 KB
-
Two-dimensional schematic diagram of quartz, silica, and silica-based glass.png 2.143 × 1.344; 571 KB
-
Uebergangsgraph Ehrenfest Modell.png 1.027 × 176; 33 KB