Graph of a function: Difference between revisions
Fgnievinski (talk | contribs) |
Fgnievinski (talk | contribs) |
||
| Line 1: | Line 1: | ||
{{Short description|Mathematical representation of a function}} |
{{Short description|Mathematical representation of a function}} |
||
{{for-multi |
{{for-multi|the combinatorial structure|Graph (discrete mathematics)|the graph-theoretic representation of a function from a set to itself|Functional graph}} |
||
{{more citations needed|date=August 2014}} |
{{more citations needed|date=August 2014}} |
||
[[File:Polynomial of degree three.svg|thumb|250x250px|Graph of the function <math>f(x)=\frac{x^3+3x^2-6x-8}{4}.</math>]] |
[[File:Polynomial of degree three.svg|thumb|250x250px|Graph of the function <math>f(x)=\frac{x^3+3x^2-6x-8}{4}.</math>]] |
||
| Line 6: | Line 6: | ||
In [[mathematics]], the '''graph of a [[Function (mathematics)|function]]''' <math>f</math> is the set of [[ordered pair]]s <math>(x, y)</math>, where <math>f(x) = y.</math> In the common case where <math>x</math> and <math>f(x)</math> are [[real number]]s, these pairs are [[Cartesian coordinates]] of points in a [[plane (geometry)|plane]] and often form a [[curve]] in this plane. |
In [[mathematics]], the '''graph of a [[Function (mathematics)|function]]''' <math>f</math> is the set of [[ordered pair]]s <math>(x, y)</math>, where <math>f(x) = y.</math> In the common case where <math>x</math> and <math>f(x)</math> are [[real number]]s, these pairs are [[Cartesian coordinates]] of points in a [[plane (geometry)|plane]] and often form a [[curve]] in this plane. |
||
The graphical representation of the graph of a function is also known as a ''[[Plot (graphics)|plot]]''. |
|||
In the case of functions of two variables, that is functions whose [[Domain of a function|domain]] consists of pairs <math>(x, y),</math> the graph usually refers to the set of [[ordered triple]]s <math>(x, y, z)</math> where <math>f(x,y) = z,</math> instead of the pairs <math>((x, y), z)</math> as in the definition above. This set is a subset of [[three-dimensional space]]; for a continuous [[real-valued function]] of two real variables, it is a [[Surface (mathematics)|surface]]. |
In the case of functions of two variables, that is functions whose [[Domain of a function|domain]] consists of pairs <math>(x, y),</math> the graph usually refers to the set of [[ordered triple]]s <math>(x, y, z)</math> where <math>f(x,y) = z,</math> instead of the pairs <math>((x, y), z)</math> as in the definition above. This set is a subset of [[three-dimensional space]]; for a continuous [[real-valued function]] of two real variables, it is a [[Surface (mathematics)|surface]]. |
||
Revision as of 05:29, 15 November 2023
This article needs additional citations for verification. (August 2014) |

| Function |
|---|
| x ↦ f (x) |
| History of the function concept |
| Examples of domains and codomains |
| Classes/properties |
| Constructions |
| Generalizations |
In mathematics, the graph of a function is the set of ordered pairs , where In the common case where and are real numbers, these pairs are Cartesian coordinates of points in a plane and often form a curve in this plane. The graphical representation of the graph of a function is also known as a plot.
In the case of functions of two variables, that is functions whose domain consists of pairs the graph usually refers to the set of ordered triples where instead of the pairs as in the definition above. This set is a subset of three-dimensional space; for a continuous real-valued function of two real variables, it is a surface.
In science, engineering, technology, finance, and other areas, graphs are tools used for many purposes. In the simplest case one variable is plotted as a function of another, typically using rectangular axes; see Plot (graphics) for details.
A graph of a function is a special case of a relation. In the modern foundations of mathematics, and, typically, in set theory, a function is actually equal to its graph.[1] However, it is often useful to see functions as mappings,[2] which consist not only of the relation between input and output, but also which set is the domain, and which set is the codomain. For example, to say that a function is onto (surjective) or not the codomain should be taken into account. The graph of a function on its own does not determine the codomain. It is common[3] to use both terms function and graph of a function since even if considered the same object, they indicate viewing it from a different perspective.

Definition
Given a mapping in other words a function together with its domain and codomain the graph of the mapping is[4] the set
which is a subset of . In the abstract definition of a function, is actually equal to
One can observe that, if, then the graph is a subset of (strictly speaking it is but one can embed it with the natural isomorphism).
Examples
Functions of one variable
The graph of the function defined by is the subset of the set
From the graph, the domain is recovered as the set of first component of each pair in the graph . Similarly, the range can be recovered as . The codomain , however, cannot be determined from the graph alone.
The graph of the cubic polynomial on the real line is
If this set is plotted on a Cartesian plane, the result is a curve (see figure).
Functions of two variables
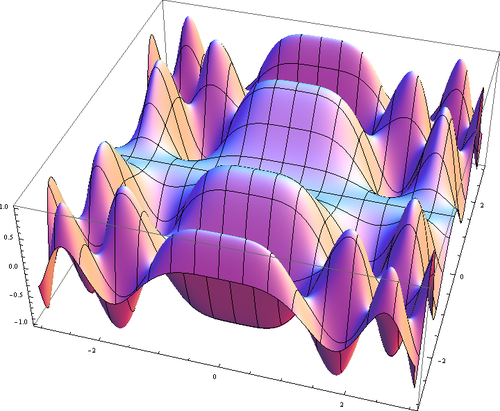
The graph of the trigonometric function is
If this set is plotted on a three dimensional Cartesian coordinate system, the result is a surface (see figure).
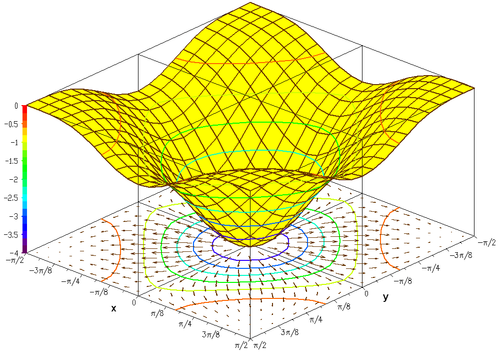
Oftentimes it is helpful to show with the graph, the gradient of the function and several level curves. The level curves can be mapped on the function surface or can be projected on the bottom plane. The second figure shows such a drawing of the graph of the function:
See also
References
- ^ Charles C Pinter (2014) [1971]. A Book of Set Theory. Dover Publications. p. 49. ISBN 978-0-486-79549-2.
- ^ T. M. Apostol (1981). Mathematical Analysis. Addison-Wesley. p. 35.
- ^ P. R. Halmos (1982). A Hilbert Space Problem Book. Springer-Verlag. p. 31. ISBN 0-387-90685-1.
- ^ D. S. Bridges (1991). Foundations of Real and Abstract Analysis. Springer. p. 285. ISBN 0-387-98239-6.
- Zălinescu, Constantin (30 July 2002). Convex Analysis in General Vector Spaces. River Edge, N.J. London: World Scientific Publishing. ISBN 978-981-4488-15-0. MR 1921556. OCLC 285163112 – via Internet Archive.
External links
- Weisstein, Eric W. "Function Graph." From MathWorld—A Wolfram Web Resource.
| Authority control databases: National |
|---|