Home energy monitor: Difference between revisions
Dougmcdonell (talk | contribs) move |
Dougmcdonell (talk | contribs) remove fluff & notice |
||
| Line 1: | Line 1: | ||
{{Essay-like|date=January 2013}} |
|||
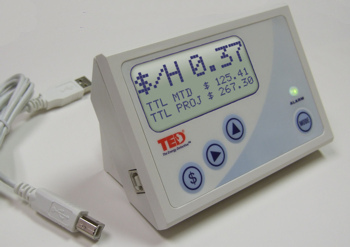
[[File:TED Model 1001.jpg|thumb|200px|right|The Energy Detective]] |
[[File:TED Model 1001.jpg|thumb|200px|right|The Energy Detective]] |
||
[[File:Detailed Power usage.png|thumb|200px|right|Example of detailed power finger prints]] |
[[File:Detailed Power usage.png|thumb|200px|right|Example of detailed power finger prints]] |
||
A '''home energy monitor''' provides |
A '''home energy monitor''' provides feedback on electrical energy use. Devices may also display cost of energy used, and estimates of greenhouse gas emissions. Various studies have shown a reduction in home energy use of 4-15% through use of home energy display.<ref>{{cite report| url = http://www.idc.com/EI/getdoc.jsp?containerId=EI211079 | |
||
title = In-Home Display Units: An Evolving Market, Part 1 | author = Jan Borstein, Karen Blackmore | date = March 2008}}</ref> |
title = In-Home Display Units: An Evolving Market, Part 1 | author = Jan Borstein, Karen Blackmore | date = March 2008}}</ref> |
||
Electricity use may be measured with an [[Current clamp|inductive clamp]] placed around the electric main, via the [[electric meter]] (either through an optical port, or by sensing the meters actions), by communicating with a smart meter, or by direct connection to the electrical system. The display portion may be remote from the measurement, communicating with the sensor using a cable, network, [[power line communication]]s, or using radio. Online displays are also available which allow the user to use an internet connected display to show near real-time consumption. |
Electricity use may be measured with an [[Current clamp|inductive clamp]] placed around the electric main, via the [[electric meter]] (either through an optical port, or by sensing the meters actions), by communicating with a smart meter, or by direct connection to the electrical system. The display portion may be remote from the measurement, communicating with the sensor using a cable, network, [[power line communication]]s, or using radio. Online displays are also available which allow the user to use an internet connected display to show near real-time consumption. |
||
A |
A means to [[energy conservation|reduce household energy consumption]] is to provide real-time feedback to homeowners so they can change their energy use. In 2010, UK based Current Cost announced a partnership with [[Google PowerMeter]], a former online tool that connected to Current Cost devices, enabling users to receive real-time energy information on their customised Google homepage, wherever they were. Real-time data on how much energy is being consumed in the home was sent directly to the Google PowerMeter. The free software tool then visualised the information for users to view on their own iGoogle homepage, a personal web portal which enabled individuals to create and access a wide range of customisable information, web feeds and Google Gadgets. |
||
'''Note''' Google Power Meter is now defunct. |
'''Note''' Google Power Meter is now defunct. |
||
Revision as of 03:34, 20 February 2016

A home energy monitor provides feedback on electrical energy use. Devices may also display cost of energy used, and estimates of greenhouse gas emissions. Various studies have shown a reduction in home energy use of 4-15% through use of home energy display.[1]
Electricity use may be measured with an inductive clamp placed around the electric main, via the electric meter (either through an optical port, or by sensing the meters actions), by communicating with a smart meter, or by direct connection to the electrical system. The display portion may be remote from the measurement, communicating with the sensor using a cable, network, power line communications, or using radio. Online displays are also available which allow the user to use an internet connected display to show near real-time consumption.
A means to reduce household energy consumption is to provide real-time feedback to homeowners so they can change their energy use. In 2010, UK based Current Cost announced a partnership with Google PowerMeter, a former online tool that connected to Current Cost devices, enabling users to receive real-time energy information on their customised Google homepage, wherever they were. Real-time data on how much energy is being consumed in the home was sent directly to the Google PowerMeter. The free software tool then visualised the information for users to view on their own iGoogle homepage, a personal web portal which enabled individuals to create and access a wide range of customisable information, web feeds and Google Gadgets. Note Google Power Meter is now defunct.
A study using the PowerCost Monitor deployed in 500 Ontario homes by Hydro One showed an average 6.5% drop in total electricity use when compared with a similarly sized control group. Hydro One subsequently offered free power monitors to 30,000 customers based on the success of the pilot.[2] Blue Line Innovations also indicates 100,000 units in the market today.
Another study carried out in the city of Sabadell (Spain) in 2009 using the efergy e2 in 29 households during a six-month period came to 11.8% on a weekly comparison between the first and last weeks of the campaign. On a monthly basis, the savings were 14.3%. Expected annual CO2 savings for all households is estimated to be 4.1 tonnes; projected CO2 emissions savings for 2020 are 180.6 tonnes.[3]
In January 2009 the government of the state of Queensland, Australia began offering wireless energy monitors as part of its ClimateSmart Home Service program. By August 2009, almost 100,000 homes had signed up for the service, by August 2010 that number had risen to 200,000 homes.[4] By the end of the program more than 335,000 households across Queensland had received the service with the Elite energy monitoring device supplied by Efergy Technologies.
In mid-2013 the government of the state of Victoria, Australia enabled Zigbee-based In-Home Displays to be connected to Victorian Smart Meter [5]
See also
- AlertMe
- Energy management software
- Google PowerMeter
- Energy conservation
- Hohm
- Home automation
- Kill A Watt
- Nonintrusive load monitoring
- Smart meter
- Universal Metering Interface (UMI)
- Wattmeter
References
- ^ Jan Borstein, Karen Blackmore (March 2008). In-Home Display Units: An Evolving Market, Part 1 (Report).
- ^ http://www.energetics.com/madri/pdfs/ChartwellHydroOneMonitoringProgram.pdf
- ^ http://www.managenergy.net/resources/1416
- ^ http://statements.cabinet.qld.gov.au/MMS/StatementDisplaySingle.aspx?id=65667 and http://statements.cabinet.qld.gov.au/MMS/StatementDisplaySingle.aspx?id=70926
- ^ http://www.switchon.vic.gov.au/how-can-i-take-charge-of-my-power-bill/energy-saver-incentive/in-home-