Performance results from CLI, Node, Audit and Extension are very different #9957
Comments
|
Thanks for filing @rubyzhao! tl;dr of your question - use the CLI because it will be the latest LH version and it uses a clean Chrome profile for most accurate new user results.
It is an ultrasimple benchmark meant to give a very quick baseline for how powerful a machine is. It will vary based on many other factors: current CPU load, other active tabs, battery remaining, etc. The import thing here is the magnitude 10 v. 100 v. 1000, anything 500-700 is roughly all the same.
CLI/node module should be the same because they're the same Lighthouse version launching Chrome the same way in the same environment. You're seeing large differences between DevTools/Extension/CLI because they are using different Lighthouse versions with different Chrome profiles and different environments. We have several good documents on the topic of variability that explain some of these differences. Also FWIW, as a user of this demo page, its performance is highly variable on my machine. When the page itself has varying performance characteristics, the measurements will inevitably be variable as well. |
|
Thanks for the detail explanation. LH still gives more consistent result when run it more times for the same page than Puppeteer or Console from Chrome. Would you help on performance from Pupeteer and Console of Chrome? I even use only 1 line web page to dig out the issue. For each repeat test, I will clean the console, reload the page. Please see the detail below: If I want get TaskDuration, domComplete etc performance metrics, what is the best way/tool you suggest? Thanks in advance. |
|
If you want raw timings like that, there's really no better way than running with puppeteer, averaging the results of multiple runs, and discarding outliers, sorry :/ |
|
Thanks for your great help. |
Provide the steps to reproduce
There are 4 ways to use Lighthouse
Setup the server
Get the 4 different results
Audit.zip
Extension.zip
Get Canvas.report.html output.zip
Get result
Node_LightHouseOutput.zip
What is the current behavior?
Please see the part of performance results from 4 different ways. All 4 ways use same setting:

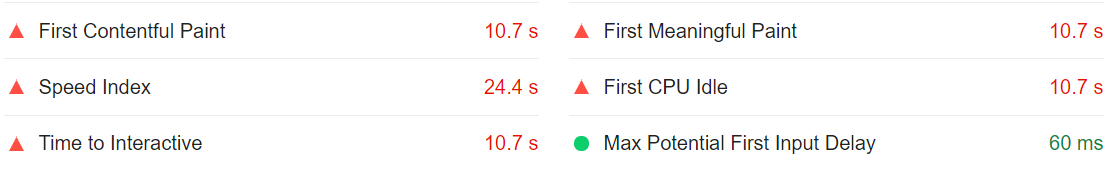
Performance from Audits:

CPU/Memory Power: 680
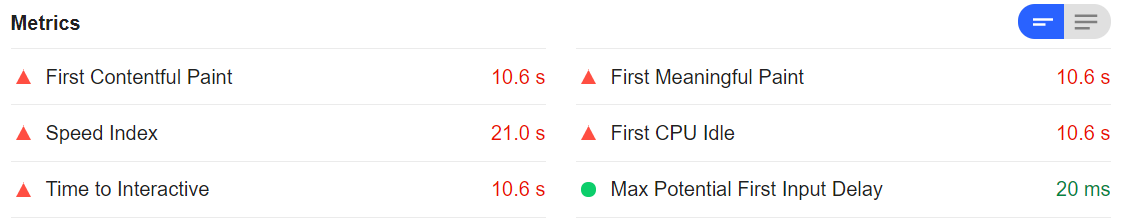
Performance from Extension:

CPU/Memory Power: 613
Performance from node CLI:
CPU/Memory Power: 540
Performance from node Module:
CPU/Memory Power: 707
What is the expected behavior?
The 4 ways should give very close result. But there are a lot of difference.
What is the best way we should use in the future?
Based on the above performance result, Node Module gives the best performance result. Extension shows the worst performance.
Environment Information
Related issues
The text was updated successfully, but these errors were encountered: