We read every piece of feedback, and take your input very seriously.
To see all available qualifiers, see our documentation.
Have a question about this project? Sign up for a free GitHub account to open an issue and contact its maintainers and the community.
By clicking “Sign up for GitHub”, you agree to our terms of service and privacy statement. We’ll occasionally send you account related emails.
Already on GitHub? Sign in to your account
Hi, I use your plug-in on my project, and I detect one problem, when I execute my scenario this don't show the total user in Grafana vs Jmeter.
*The dashboir only count 4 user and not total 6 users. *The execution is on local machine
Config scenario: 6 uvc during 2 minutes whit 6 step
Config on pluig-in influx db jmeter:
Grafana Dashboard:
The text was updated successfully, but these errors were encountered:
Hello, @cquirozglobant, very strange. Need to take look.
BR, Mike
Sorry, something went wrong.
No branches or pull requests
Hi, I use your plug-in on my project, and I detect one problem, when I execute my scenario this don't show the total user in Grafana vs Jmeter.
*The dashboir only count 4 user and not total 6 users.
*The execution is on local machine
Config scenario:
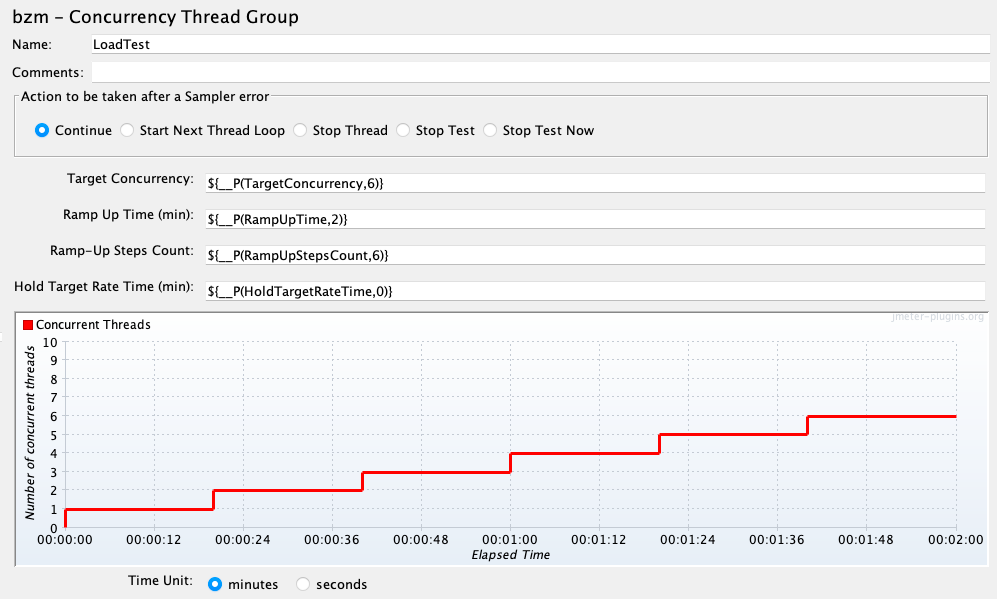
6 uvc during 2 minutes whit 6 step
Config on pluig-in influx db jmeter:

Grafana Dashboard:

The text was updated successfully, but these errors were encountered: