You signed in with another tab or window. Reload to refresh your session.You signed out in another tab or window. Reload to refresh your session.You switched accounts on another tab or window. Reload to refresh your session.Dismiss alert
[✔] I have checked that this issue has not already been reported.
[✔ ] I have confirmed this bug exists on the latest version of scanpy.
[✔] (optional) I have confirmed this bug exists on the master branch of scanpy.
Note: Please read this guide detailing how to provide the necessary information for us to reproduce your bug.
Hello Scanpy,
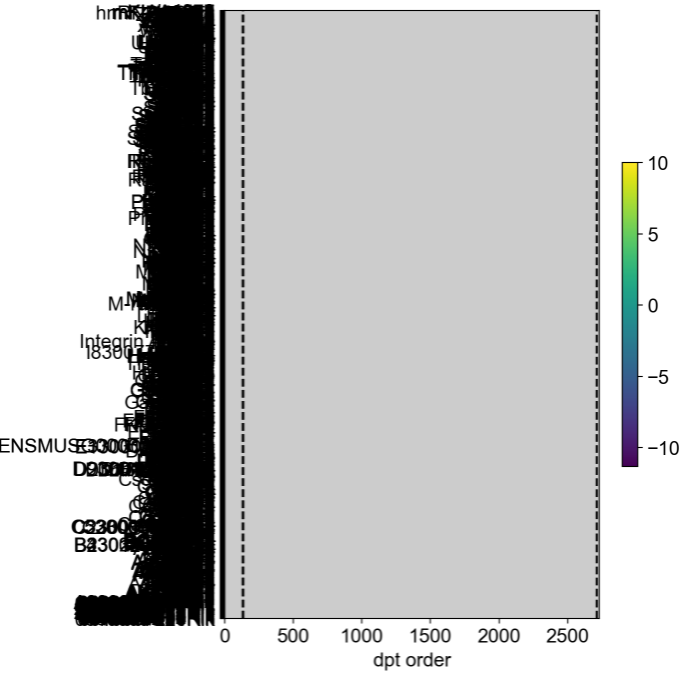
I'm using the DPT. Every function works fine except sc.pl.dpt_timeseries(adata). I got no colors of the plot.
Could you please help me with this issue?
Thanks!
Best,
YJ
Minimal code sample (that we can copy&paste without having any data)
Note: Please read this guide detailing how to provide the necessary information for us to reproduce your bug.

Hello Scanpy,
I'm using the DPT. Every function works fine except
sc.pl.dpt_timeseries(adata). I got no colors of the plot.Could you please help me with this issue?
Thanks!
Best,
YJ
Minimal code sample (that we can copy&paste without having any data)
Versions
sc.pl.dpt_timeseries(adata, color_map='viridis', show=True)
The text was updated successfully, but these errors were encountered: