Файл:Modus Felapton.svg

Повна роздільність (SVG-файл, номінально 718 × 1094 пікселів, розмір файлу: 181 КБ)
| Відомості про цей файл містяться на Вікісховищі — централізованому сховищі вільних файлів мультимедіа для використання у проектах Фонду Вікімедіа. |
Опис файлу
| Опис |
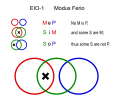
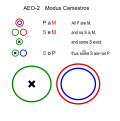
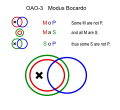
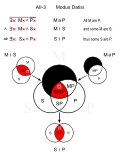
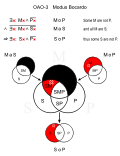
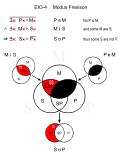
One of the 24 syllogisms listed below. The deduction is represented by a 3 circle Venn diagram. The left circle stands for S, the top circle for M, and the right circle for P. Areas marked in black are empty - there are no elements in these areas.
|
||||
| Джерело | Власна робота | ||||
| Автор |
|
||||
| Ліцензія (Повторне використання цього файлу) |
|
||||
| Інші версії | Printable version of this set: Syllogism diagrams.pdf |
All Syllogisms
This table shows 14 essentially different syllogisms represented by their Euler diagrams in the top row.
Below it shows all 24 syllogisms represented by Venn diagrams, ordered by figure, in the rows below.
Syllogisms with the same diagrams are in the same column.
The border between columns is left out when the diagrams are each others reflections.
Syllogisms with affirmative conclusions are on the left side, and those with negative conclusions are on the right side.

|

|

|

|

|

|

|
|

|

|

|
|

|
| |
| 1 | 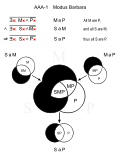 Barbara |
 Barbari |
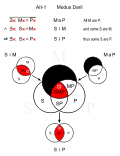 Darii |
 Ferio |
 Celaront |
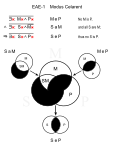 Celarent |
||||||||
| 2 |  Festino |
 Cesaro |
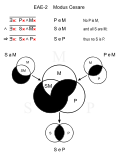 Cesare |
 Camestres |
 Camestros |
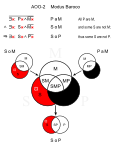 Baroco |
||||||||
| 3 |  Darapti |
 Datisi |
 Disamis |
 Felapton |
 Ferison |
 Bocardo | ||||||||
| 4 |  Bamalip |
 Dimatis |
 Fesapo |
 Fresison |
 Calemes |
 Calemos |
Історія файлу
Клацніть на дату/час, щоб переглянути, як тоді виглядав файл.
| Дата/час | Мініатюра | Розмір об'єкта | Користувач | Коментар | |
|---|---|---|---|---|---|
| поточний | 18:18, 7 травня 2010 | 718 × 1094 (181 КБ) | Watchduck | included labeling of the circles | |
| 02:30, 18 березня 2010 | 718 × 1094 (179 КБ) | Watchduck | {{Information |Description={{Information |Description=One of the 24 syllogisms listed below. The deduction is represented by a 3 circle Venn diagram.<br>Premises and the logical conseq |
Використання файлу
Такі сторінки використовують цей файл:
Глобальне використання файлу
Цей файл використовують такі інші вікі:
- Використання в bg.wikipedia.org
- Використання в ca.wikipedia.org
- Використання в cs.wikipedia.org
- Використання в da.wikipedia.org
- Використання в en.wikipedia.org
- Використання в en.wikiversity.org
- Використання в eo.wikipedia.org
- Використання в es.wikipedia.org
- Використання в et.wikipedia.org
- Використання в fi.wikipedia.org
- Використання в fr.wikipedia.org
- Використання в he.wikipedia.org
- Використання в hi.wikipedia.org
- Використання в hu.wikipedia.org
- Використання в ia.wikipedia.org
- Використання в io.wikipedia.org
- Використання в is.wikipedia.org
- Використання в it.wikipedia.org
- Використання в ja.wikipedia.org
- Використання в ko.wikipedia.org
- Використання в lb.wikipedia.org
- Використання в nl.wikipedia.org
- Використання в nov.wikipedia.org
- Використання в pl.wikipedia.org
- Використання в pl.wikibooks.org
- Використання в pt.wikipedia.org
- Використання в ro.wikipedia.org
- Використання в ru.wikipedia.org
- Використання в sk.wikipedia.org
- Використання в sr.wikipedia.org
- Використання в tl.wikipedia.org
- Використання в zh.wikipedia.org